Module 05
Reports and insights
A report is a saved search that aggregates. Sharing one shares the question, never the answer.
What it does
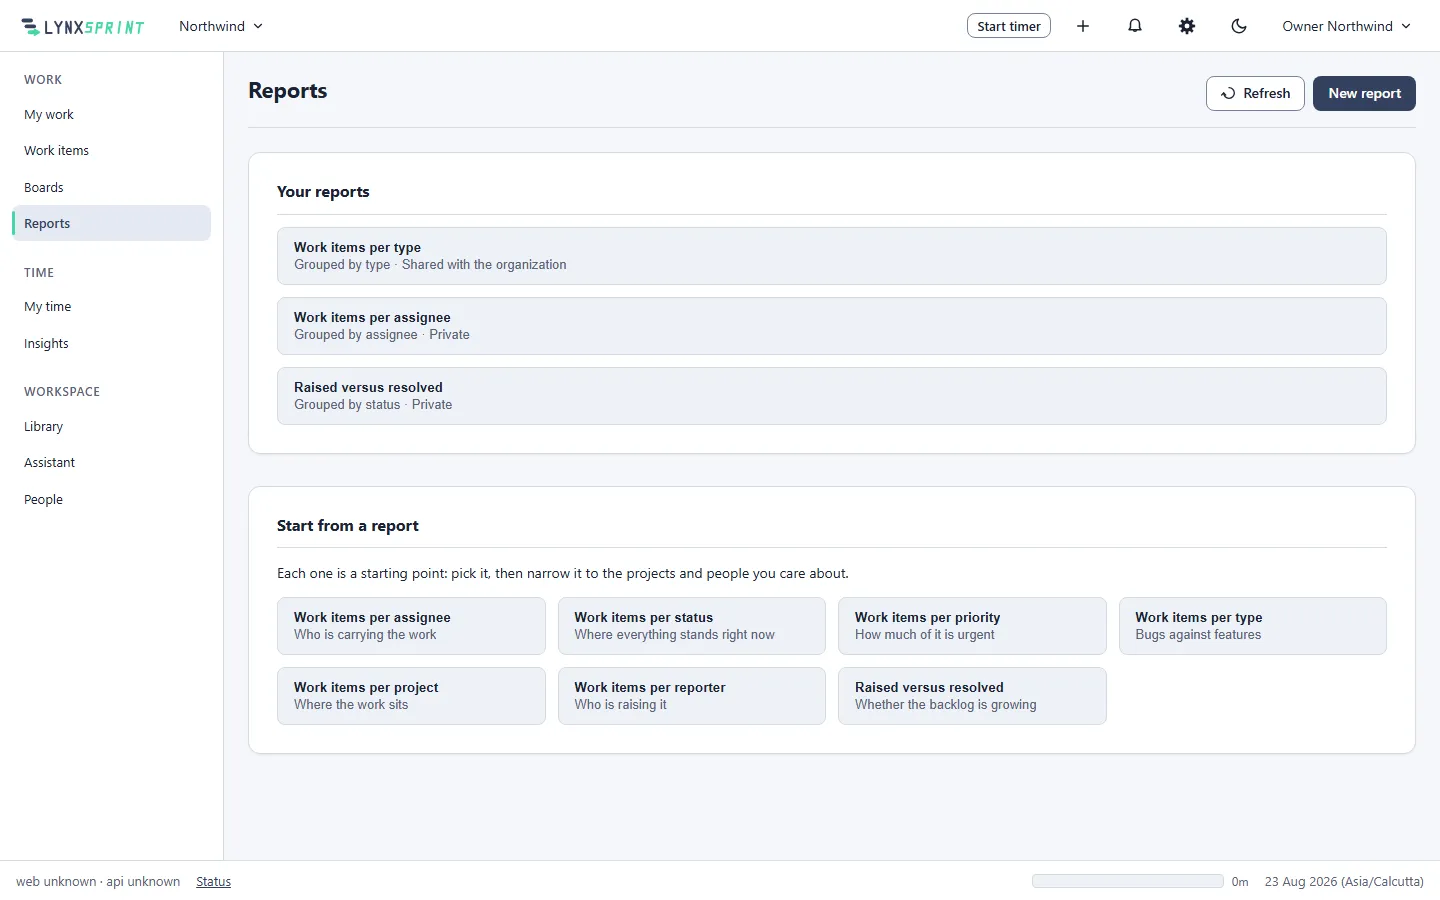
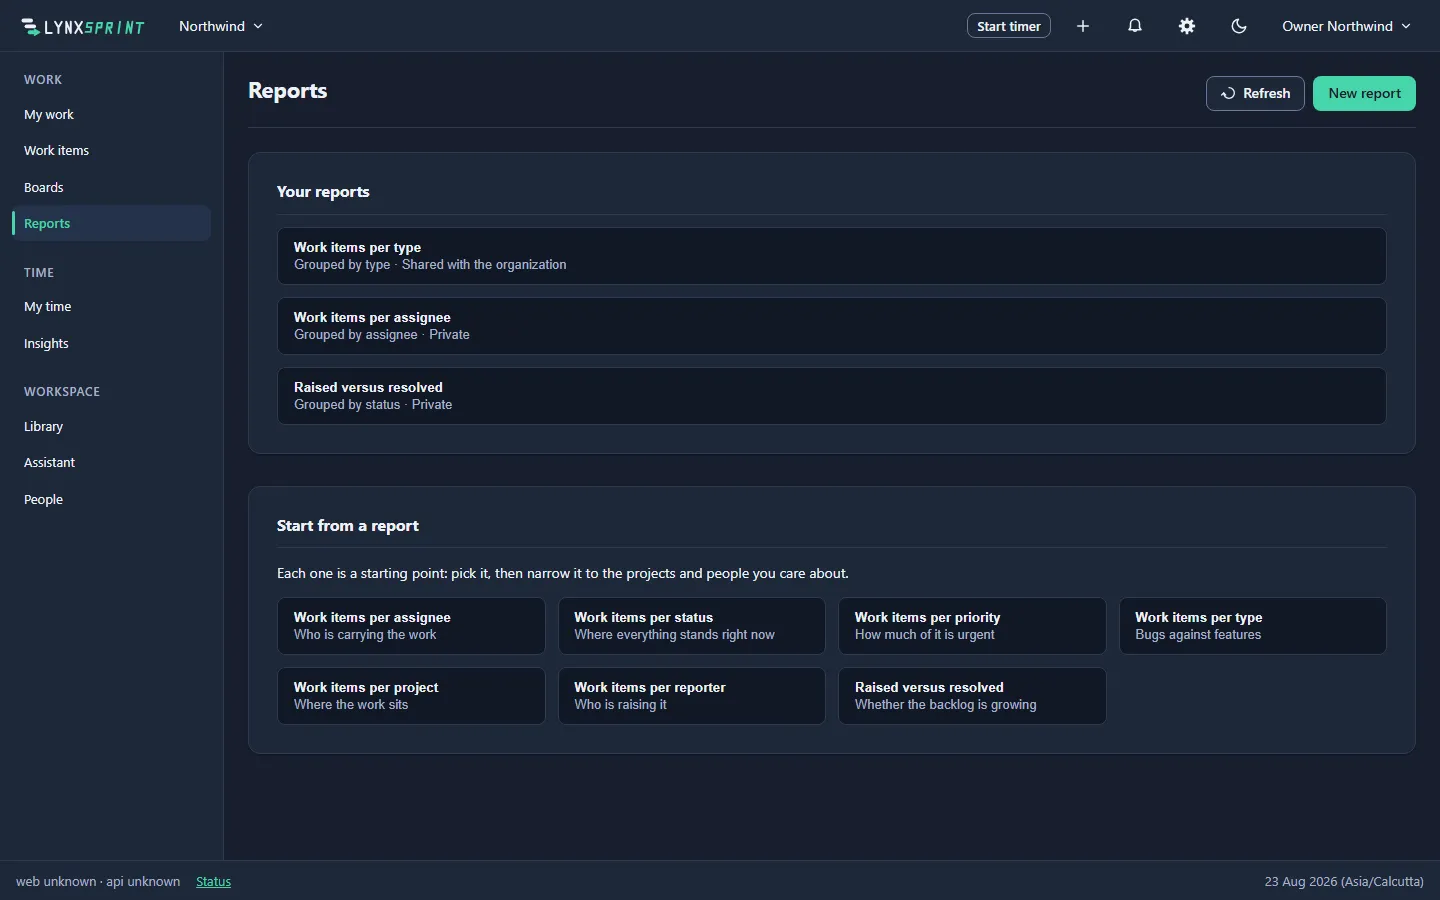
- A shared report is a shared question
- Running one is computed per viewer, so a report cannot count a row its reader could not open. Two people opening the same shared report get two honest answers.
- Counted as events, not as items
- In a timeline report a reopened and refixed item counts twice, because counting once per item would make a past week's number change when somebody reopens an old ticket today.
- The empty bucket is kept and named
- Unassigned work appears as Unassigned rather than vanishing from the chart. A total that silently excludes the rows nobody owns is the one people act on and should not.
- Bounded rather than indexed
- A report too broad to answer is refused rather than left running. No index was added to work items to speed a screen opened twice a day, because an index is a cost paid by every write forever.
What it is not
Naming the ceiling is what makes everything above it credible. The roadmap says which of these are deferred and why.
- A query language or a formula builder.
- Custom-field axes, which are deliberately deferred.
- Scheduled report delivery by email.
The rest of the product
-
Module 01
Work items and projects
Your own vocabulary, typed custom fields, links and saved searches.
-
Module 02
Boards and sprints
Boards across several projects, sprints with goals, and a backlog.
-
Module 03
Time tracking
Timer, day timeline and week grid, over correct time-zone arithmetic.
-
Module 04
Timesheets and approvals
A state machine with a decision log, and nobody approves their own.
-
Module 06
The Library
Collections and articles under one permission model, stored as markdown.
-
Module 07
Permissions and people
112 codes, 7 scopes, 9 role templates, and an append-only audit trail.
-
Module 08
Service desk and portal
Queues, SLA clocks against your working calendar, and a customer portal.